RV Blog Stock-market Taking the Elevator Up

Taking the Elevator Up

The VIX has been rising with the S&P 500. This is very rare.

A rare market signal has been flashing this past week which caught my attention.

As U.S. equity indices have continued to rise, their respective measures of implied volatility have soared alongside them.

The S&P 500 and the VIX moved in tandem:

As have the Nasdaq 100 Index and the CBOE NDX Volatility Index (VOLQ):

As a result, the correlation between the S&P 500 and the VIX has turned positive for the first time since June 2019:

And the correlation between the Nasdaq 100 and the CBOE NDX Volatility Index has turned positive as well, for the first time since October 2018:

As you can see above, vol-up rallies are quite rare. “They’re a function of variance to the upside, higher vol due to the echo of volatility from March, and election trepidation,” wrote Jason Buck, CIO of Mutiny Fund and Real Vision contributor, over email.

A look at the VIX futures curve supports Jason’s point. The peak of the curve can be found at October 21, indicating that the October 21 – November 21 futures are a hotbed of expected volatility as the 2020 presidential election will be held on November 3.

“People falsely believe vol is negatively correlated to the S&P,” continued Buck. “Vol is actually derived from outsized moves in either direction – it just happens that most of the time this is to the downside (‘stairs up, elevator down’). In a melt-up, stocks and volatility can go up at the same time… like the dot-com bubble or Abe-nomics in Japan.”

Indeed, under Shinzo Abe, positive correlations between the Nikkei 225 and its implied volatility abounded – and they have been a hallmark of the Japanese markets even before “Abenomics.”

Upon Abe’s resignation today, however, volatility spiked as the Nikkei tumbled.

But back to the matter at hand. What does it all mean?

To be honest, I don’t know. I need to do more digging and see if I can find out – to see if there is a signal behind all the noise.

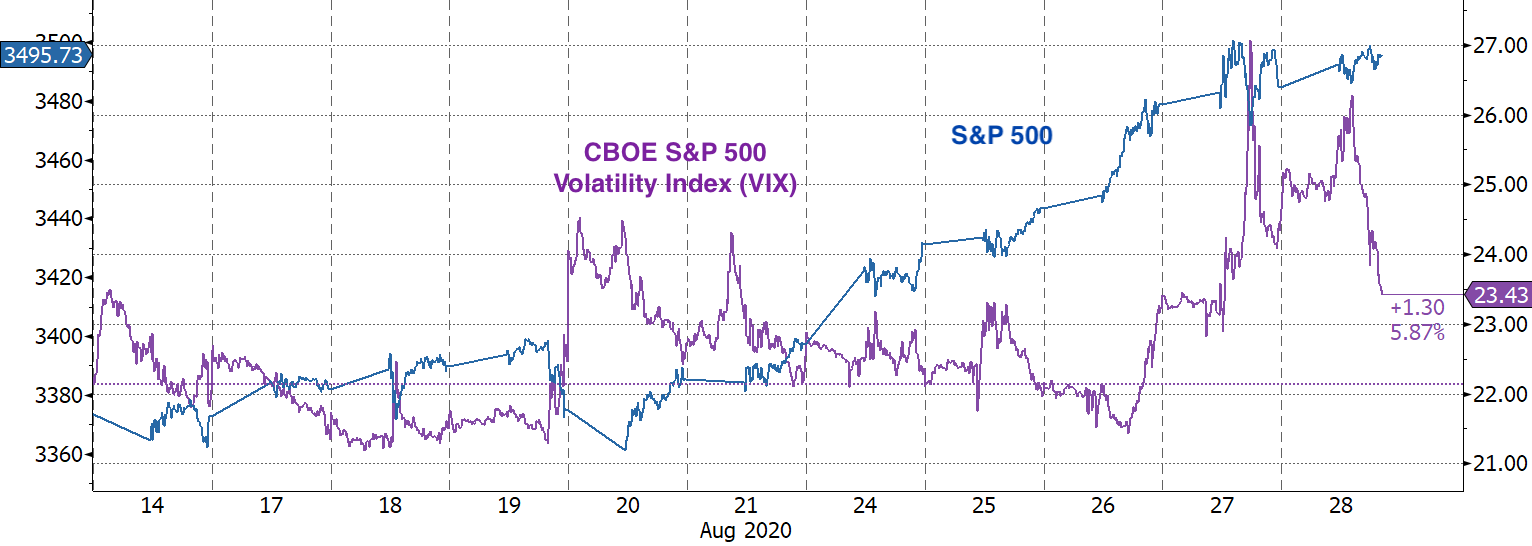
There is something Jason Buck wrote that could be a potential first breadcrumb: “you are unlikely to see this [positive] correlation in low vol environments.” So we could be in a high vol regime, and hearing the echo of this year’s “March madness”:

This would mean that the markets are experiencing the residual effect of the transition from a low-vol regime to a high vol regime.

In addition, could “call skew” be causing this correlation to go positive? The put/call ratio for the S&P 500 is perched just above its 20-year low…

The mystery remains unsolved – at least by me, at least for now.

If you really want to go deep in the weeds on volatility over the weekend, I recommend you read Mike Green and Wayne Himelsein’s recent piece on illiquidity in the futures markets. It’s brilliant.

RELATED CATEGORIES: Market Analysis, Stock Market

GET REAL VISION'S FREE DAILY BRIEFING DELIVERED DIRECTLY TO YOUR INBOX EVERY DAY AFTER MARKETS CLOSE

Get the latest information as we analyze the next phase of our new global economy and discuss what we think is to come.